Our services have earned the trust of companies, schools, and organizations globally, and we remain dedicated to maintaining that trust.
Why LC-MS/MS for Prostaglandin Analysis?
Prostaglandins are produced at picogram-per-milliliter concentrations, have half-lives of seconds to minutes in vivo, and are generated rapidly ex vivo during sample collection by activated platelets and leukocytes. These properties make PG analysis uniquely demanding. ELISA kits, while widely used, suffer from antibody cross-reactivity — PGE2 antibodies can cross-react with PGD2 and PG metabolites by 10–30%, producing misleading values. When the research question requires distinguishing PGE2 from PGD2 — as in mPGES-1 inhibitor studies where substrate rediversion between these two species is the primary endpoint — ELISA simply cannot provide the needed specificity.
LC-MS/MS addresses all three challenges simultaneously: chromatographic separation resolves isobaric PG pairs before detection, MRM quantification with deuterated internal standards eliminates cross-reactivity and provides absolute accuracy, and a single 15-minute run quantifies all major PGs and eicosanoids across the COX, LOX, and CYP450 branches of the eicosanoid cascade.
Prostaglandin Profiling Solutions
From focused PG panels to multi-pathway eicosanoid profiling — choose the approach that matches your research question.
Targeted Prostaglandin Panel (COX Pathway)
Absolute quantification of 8 primary PGs and metabolites by scheduled MRM with deuterated internal standards. Covers the five major PG species and their stable metabolites: PGE2, PGD2, PGF2α, 6-keto PGF1α (PGI2 marker), TXB2 (TXA2 marker), 15-deoxy-PGJ2, 13,14-dihydro-15-keto PGE2, and 11-dehydro TXB2. LLOQ<0.05 ng/mL, intra-batch CV <8%, R² ≥ 0.995.Includes COX-1/COX-2 activity index (TXB2/6-keto PGF1α ratio) and PGE2/PGD2 ratio. Ideal for COX inhibitor pharmacology, inflammation models, and PG synthase target engagement studies.
Extended Eicosanoid Panel (COX + LOX + CYP450)
Comprehensive multi-pathway profiling of 20+ eicosanoids covering all three branches of the arachidonic acid cascade in a single 15-min run. Adds LOX pathway (5-HETE, 12-HETE, 15-HETE, LTB4, LTC4) and CYP450 pathway (5,6-EET through 14,15-EET, 20-HETE) to the core PG panel. Custom expansion to leukotrienes, resolvins, protectins, maresins, and isoprostanes. Multi-pathway coverage reveals substrate shunting — when COX is inhibited, does arachidonic acid flux shift to LOX or CYP450 branches? Essential for systems-level pharmacology and safety assessment of COX/mPGES-1 inhibitors.
Detectable Prostaglandins and Eicosanoids
Our standard panel covers 20+ PG species and eicosanoids across the COX, LOX, and CYP450 pathways. Isobaric pairs are chromatographically resolved — PGE2 and PGD2 are baseline-separated on a 15-min C18 gradient.
| Analyte | Pathway | Parent / Enzyme | Biological Role | LLOQ (pg/mL) |
|---|
| PGE2 | COX → mPGES-1 | PGH2 / mPGES-1 | Primary pro-inflammatory PG; vasodilation, pain sensitization, fever, tumor immune evasion | 5 |
| PGD2 | COX → H/L-PGDS | PGH2 / H-PGDS, L-PGDS | Allergic inflammation (CRTH2); anti-inflammatory via 15-d-PGJ2/PPARγ; neuroprotective | 5 |
| PGF2α | COX → PGFS | PGH2 / PGFS | Smooth muscle contraction; luteolysis; intraocular pressure regulation | 10 |
| 6-keto PGF1α | COX → PGIS | PGI2 (prostacyclin) | Stable PGI2 metabolite; anti-aggregation, vasodilation; endothelial COX-2 activity marker | 10 |
| TXB2 | COX → TXAS | TXA2 (thromboxane) | Stable TXA2 metabolite; platelet aggregation, vasoconstriction; platelet COX-1 activity marker | 5 |
| 15-deoxy-PGJ2 | COX → non-enzymatic | PGD2 dehydration | PPARγ ligand; anti-inflammatory; inhibits NF-κB; promotes resolution | 20 |
| 13,14-dihydro-15-keto PGE2 | COX → 15-PGDH | PGE2 metabolism | Major plasma PGE2 metabolite; systemic PGE2 production marker | 10 |
| 11-dehydro TXB2 | COX → 11-DH | TXB2 metabolism | Major urinary TXA2 metabolite; systemic thromboxane production marker; not artifact-prone | 10 |
| 5-HETE, 12-HETE, 15-HETE | LOX (5/12/15-LOX) | AA / 5-LOX, 12-LOX, 15-LOX | Leukocyte chemotaxis; vascular permeability; LOX pathway activity markers | 20 |
| LTB4, LTC4 | 5-LOX → LTA4H/LTC4S | LTA4 / LTA4H, LTC4S | Potent leukocyte chemoattractant (LTB4); bronchoconstriction (LTC4) | 10 |
| 5,6-/8,9-/11,12-/14,15-EET | CYP450 epoxygenase | AA / CYP2C, CYP2J | Vasodilation; anti-inflammatory; cardioprotective EDHFs; CYP pathway activity markers | 50 |
| 20-HETE | CYP450 ω-hydroxylase | AA / CYP4A, CYP4F | Vasoconstriction; renal autoregulation; pro-hypertensive | 50 |
Custom expansion available: Resolvins (RvD1–RvD4, RvE1), protectins (PD1), maresins (MaR1), isoprostanes (8-iso-PGF2α, 8-iso-PGE2), and urinary PG metabolites (PGEM, PGDM, tetranor-PGDM) for systemic PG production assessment.
Why Choose Our PG Analysis Platform
- LC-MS/MS specificity over ELISA: Chromatographic separation of isobaric PGs (PGE2/PGD2) eliminates the cross-reactivity that inflates ELISA values by 10–30%. Deuterated internal standard normalization provides absolute accuracy at sub-pg sensitivity.
- Multi-pathway coverage in a single run: COX, LOX, and CYP450 branches quantified simultaneously — revealing substrate shunting when one pathway is pharmacologically inhibited. ELISA requires separate kits for each analyte.
- PG metabolite quantitation: Measure both primary PGs and their stable metabolites (13,14-dihydro-15-keto PGE2, 11-dehydro TXB2, 6-keto PGF1α) — providing systemic production readouts that are less susceptible to ex vivo artifact.
- Ex vivo synthesis control: Indomethacin-stabilized collection (10 μM COX inhibitor), pre-chilled tubes, antioxidant cocktail (BHT 50 μM), and snap-freezing within 15 minutes of collection prevent artifactual PG generation. Deuterated internal standards spiked at the earliest possible step.
- COX-1/COX-2 activity discrimination: TXB2/6-keto PGF1α ratio reflects platelet COX-1 vs. endothelial COX-2 activity. PGE2/PGD2 ratio reveals mPGES-1 activity and substrate rediversion — direct functional readouts without requiring enzyme assays.
- Validated for drug development: Method precision (CV<8%) and sensitivity (LLOQ <0.05 ng/mL) meet the requirements of COX/mPGES-1 inhibitor pharmacology studies. Supporting pharmacokinetic-pharmacodynamic modeling with PG-based target engagement biomarkers.
Prostaglandin Analysis Workflow
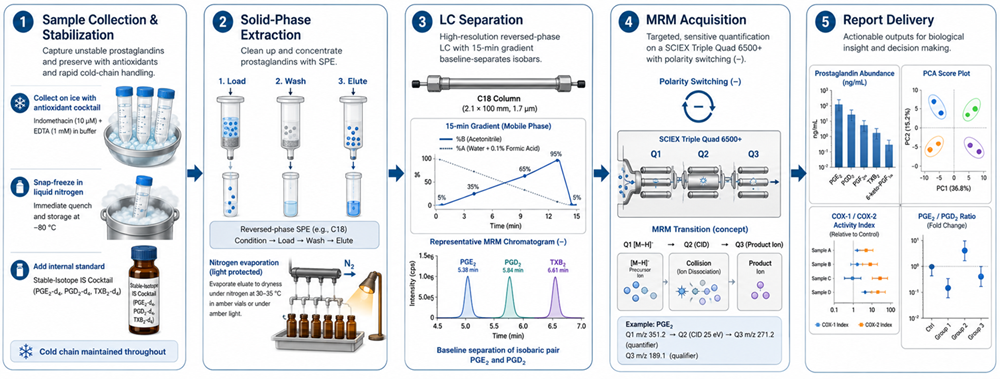
Technology Platform for PG Analysis
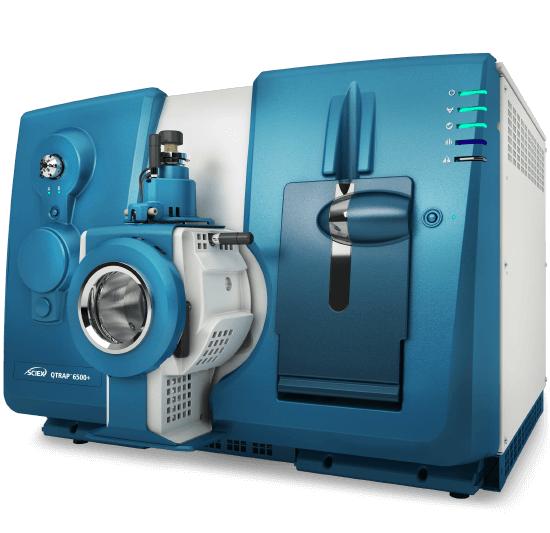
SCIEX Triple Quad 6500+ — Scheduled MRM in negative-ion ESI mode. Each PG species monitored by 2–3 transitions (quantifier + qualifier) with deuterated internal standard normalization. PGE2 and PGD2 are chromatographically baseline-resolved (ΔRT ≥ 0.5 min) on a C18 column. 15-min total run time.
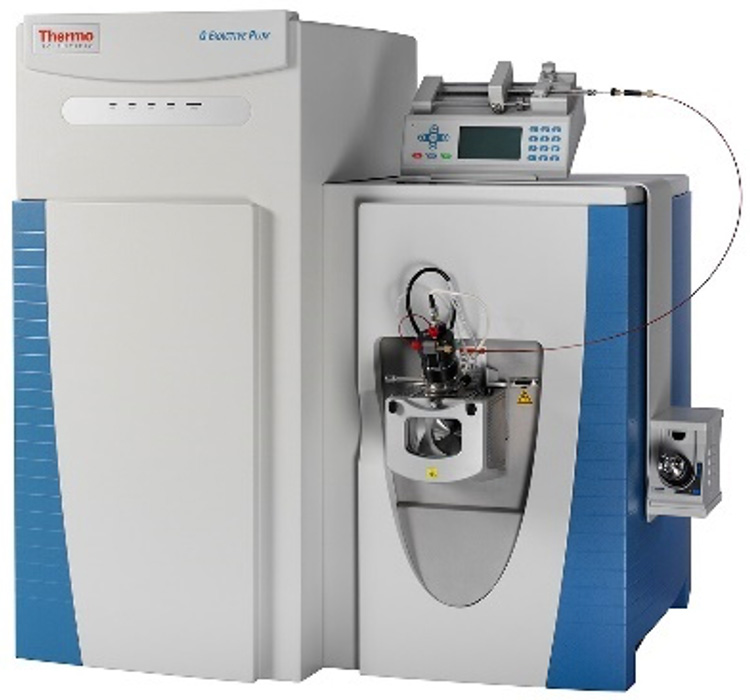
Thermo Q Exactive HF-X Orbitrap — High-resolution full-scan acquisition for novel oxylipin discovery. Parallel reaction monitoring (PRM) for confirmatory quantitation of low-abundance species.<3 ppm mass accuracy for structural confirmation of isoprostane isomers and novel PG metabolites.
LC-MS/MS Method Specifications
| Parameter | Specification |
|---|
| Chromatography | Reversed-phase C18 (2.1 × 100 mm, 1.7 μm); 15-min gradient (30–95% B); 45°C column temperature; mobile phase A: water + 0.1% acetic acid; B: acetonitrile/methanol (80:20) + 0.1% acetic acid |
| Ionization | ESI (−) with IonDrive Turbo V source; ion spray voltage −4.5 kV; source temperature 500°C; curtain gas 30 psi; GS1/GS2 50 psi |
| MRM Acquisition | Scheduled MRM, 30-s detection windows; dwell time ≥20 ms; 2–3 transitions per analyte (quantifier + qualifier); deuterated internal standard for each PG class |
| LLOQ | 5 pg/mL (PGE2, PGD2, TXB2); 10 pg/mL (6-keto PGF1α, LTB4); 20 pg/mL (HETEs, PGJ2 metabolites); 50 pg/mL (EETs, 20-HETE); S/N ≥ 10:1 |
| Precision | Intra-batch CV<8%; inter-batch CV <12%; pooled QC every 8–10 injections |
| Dynamic Range | ≥4 orders of magnitude; linearity R² ≥ 0.995 (7–9 point calibration with authentic standards) |
| Isobaric Resolution | PGE2/PGD2 baseline-resolved (Rs ≥ 1.5, ΔRT ~0.5 min); 6-keto PGF1α/TXB2 baseline-resolved |
| Ex Vivo Control | Indomethacin (10 μM) + BHT (50 μM) in collection tubes; cold centrifugation; snap-freeze within 15 min; monitor 11-dehydro TXB2/TXB2 ratio as ex vivo artifact index |
Results and Data Analysis
PG Profiling Report
Quantitative results:
- Species-level PG abundance table (pg/mL or pg/mg protein)
- COX-1/COX-2 activity index: TXB2 / 6-keto PGF1α ratio
- PGE2/PGD2 ratio — substrate rediversion readout for mPGES-1 inhibitor studies
- Multi-pathway summary: COX vs. LOX vs. CYP450 metabolite distribution
Statistical analysis:
- Principal component analysis (PCA) with 95% confidence ellipses
- Hierarchical clustering heatmap of PGs and eicosanoids across groups
- Volcano plot for pairwise comparisons
- Group-wise comparisons with t-test or ANOVA, Benjamini-Hochberg FDR correction
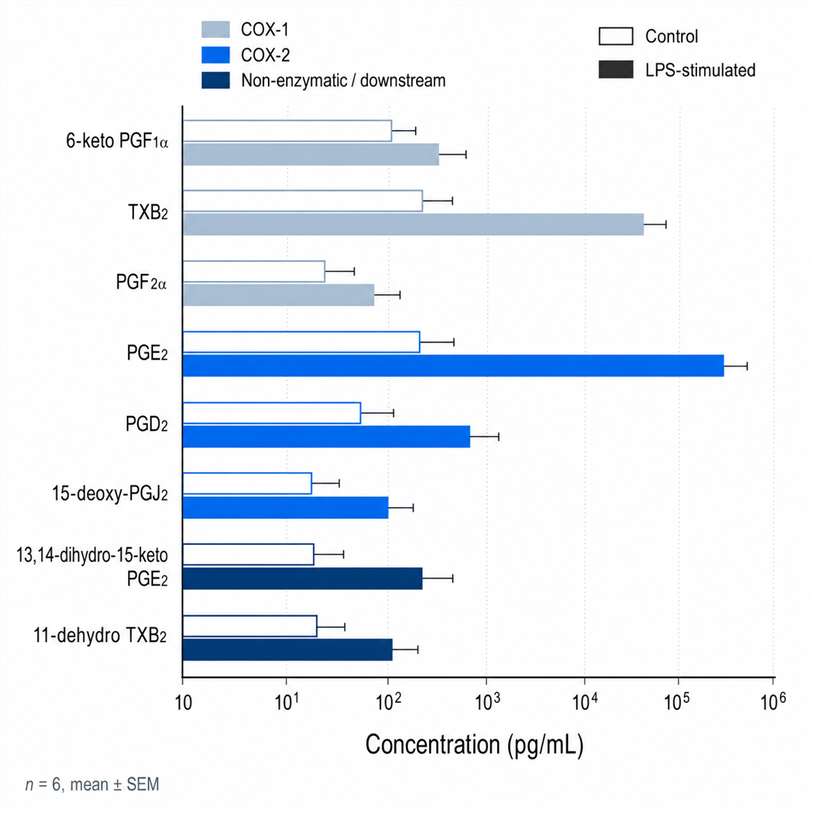
PG species abundance: LPS stimulation elevates PGE2 and TXB2 via COX-2 induction.
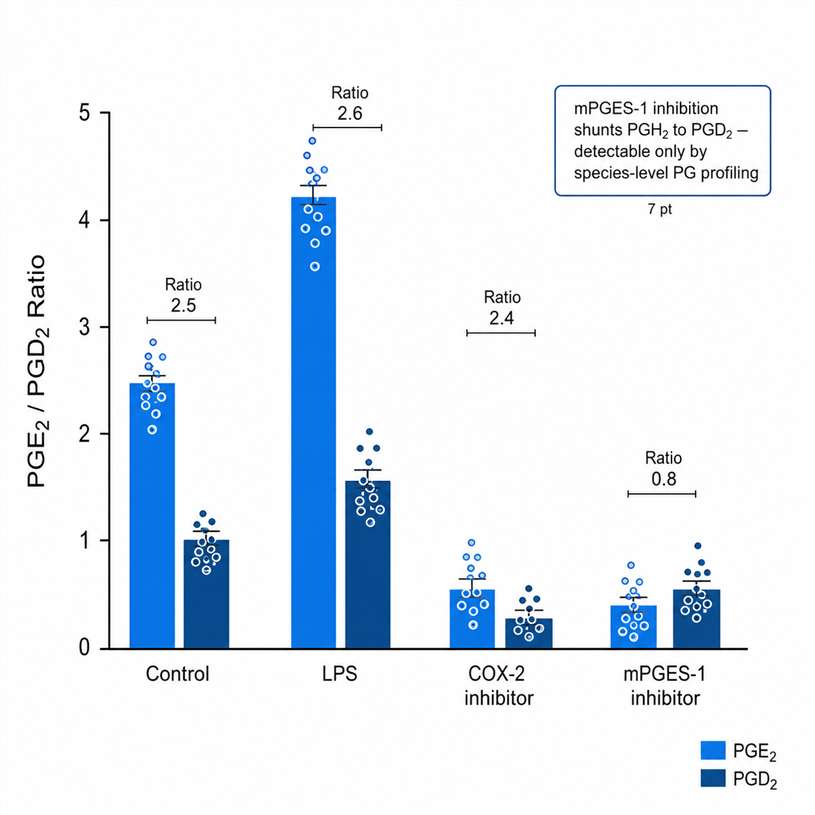
PGE2/PGD2 ratio: mPGES-1 inhibition shunts PGH2 to PGD2 — COX-2 inhibitor does not.
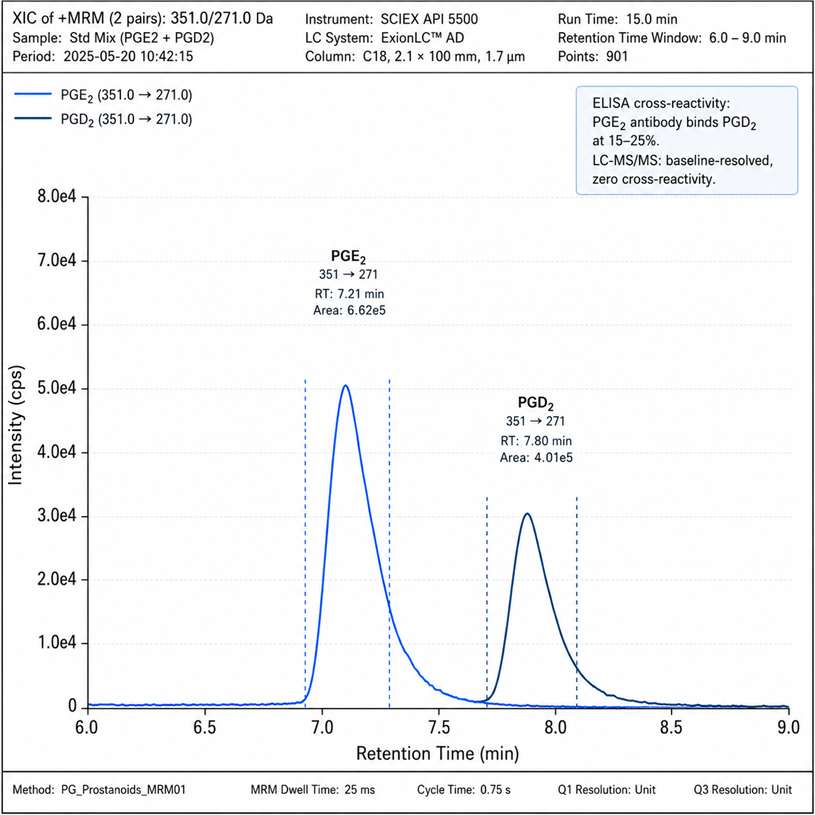
PGE2/PGD2 separation: baseline-resolved isobaric PGs — ELISA cannot distinguish these species.
Data Deliverables
- Excel workbook — PG species data with mean, SD, CV, fold change, and adjusted p-values
- PDF report — publication-ready figures with statistical summary
- Raw data package — MRM chromatograms (.wiff or .mzML), MS/MS spectra, integration boundaries
- Methodology document — complete extraction and LC-MS protocol for manuscript methods section
- QC report card — internal standard recovery, pooled QC CV distribution, ex vivo artifact index
Optional Advanced Analysis
- Extended oxylipin panel — resolvins, protectins, maresins, isoprostanes for resolution biology
- Urinary PG metabolite profiling — PGEM, PGDM, tetranor-PGDM for systemic production assessment
- Arachidonic acid flux analysis — ¹³C-AA tracer incorporation into COX/LOX/CYP450 products
- Pathway mapping — PG data integrated with arachidonic acid metabolism pathways (KEGG, Reactome)
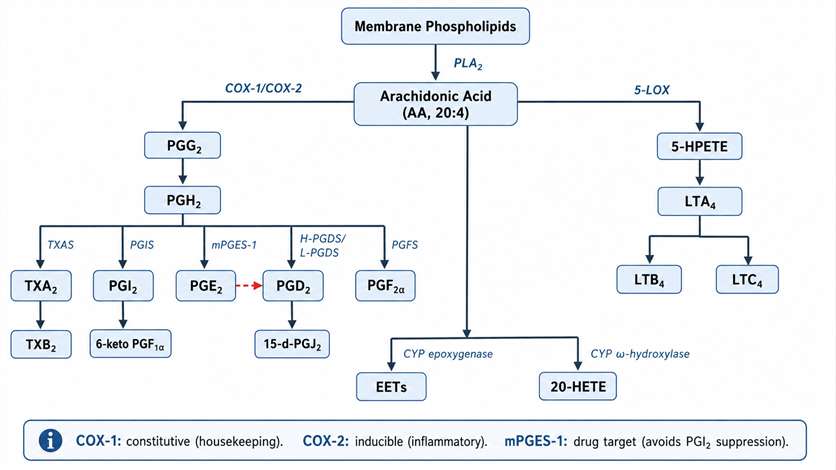 Arachidonic Acid Cascade: COX pathway (PGH2 → PGE2, PGD2, PGF2α, PGI2, TXA2), LOX pathway (5-HPETE → LTA4 → LTB4/LTC4), and CYP450 pathway (EETs, 20-HETE). mPGES-1 highlighted as drug target — PGE2/PGD2 shunt indicated with dashed arrow.
Learn more about our targeted lipidomics platform and prostaglandin analysis capabilities. Download the complete service brochure for method details, validation data, and application examples.
Download Brochure
Applications of Prostaglandin Profiling
COX & mPGES-1 Inhibitor Development
Quantify target engagement by measuring PG suppression after inhibitor treatment. Distinguish COX-1 vs. COX-2 selectivity via TXB2/6-keto PGF1α ratio. Track PGE2/PGD2 substrate shunting for mPGES-1 inhibitors — the key pharmacodynamic endpoint that ELISA cannot resolve. Support PK/PD modeling with PG-based target engagement biomarkers.
Inflammation & Immunology Research
Profile COX-2-driven PG production in LPS-stimulated macrophages, arthritis models, colitis, and airway inflammation. Monitor PGE2 elevation as a hallmark of inflammatory macrophage polarization. Distinguish pro-inflammatory PGE2 from resolution-phase PGD2 and 15-deoxy-PGJ2 generation.
Cancer Microenvironment & Immune Evasion
PGE2 is a key mediator of tumor immune evasion — promoting MDSC expansion, suppressing CTL function, and driving M2 macrophage polarization. Quantify tumor PGE2/PGD2 balance in response to COX-2 inhibitors, mPGES-1 inhibitors, and immunotherapy combinations. Track PG-mediated crosstalk between tumor cells and the immune microenvironment.
Cardiovascular Safety Pharmacology
Assess PGI2/TXA2 balance — the critical safety parameter for COX-2 and mPGES-1 inhibitors. COX-2-selective inhibitors suppress endothelial PGI2 without inhibiting platelet TXA2, increasing thrombotic risk. Quantify 6-keto PGF1α and 11-dehydro TXB2 in plasma and urine to monitor prostacyclin/thromboxane balance in preclinical models and translational research cohorts.
Sample Requirements for PG Analysis
| Sample Type | Recommended Minimum | Collection & Handling |
|---|
| Plasma / Serum | ≥100 μL | Pre-chilled EDTA-K₂ tubes with indomethacin (10 μM) + BHT (50 μM). Centrifuge at 4°C within 15 min. Snap-freeze. ≤1 freeze-thaw cycle. |
| Cell Culture Supernatant | ≥200 μL | Collect on ice. Add indomethacin (10 μM). Centrifuge to remove debris. Snap-freeze. Include unstimulated control and medium blank. |
| Tissue (Lung, Kidney, Brain, Tumor, Synovium) | 10–50 mg wet weight | Snap-freeze in liquid nitrogen immediately. Homogenize in ice-cold methanol with indomethacin (10 μM). For COX-2 expression studies, pair with snap-frozen tissue for RNA/protein analysis. |
| Urine (PG Metabolites) | ≥500 μL | Standard collection. Add BHT (50 μM). Record total volume. No stabilization beyond standard collection required for PG metabolites. |
| BALF / CSF | ≥500 μL (BALF), ≥200 μL (CSF) | Collect into pre-chilled tubes with indomethacin. Centrifuge to remove cells. Snap-freeze immediately. |
| Client-Prepared Extracts | Equivalent to above | SPE or liquid-liquid extraction. Include deuterated internal standards before extraction. Dry under nitrogen. Ship in amber vials on dry ice. |
Frequently Asked Questions About PG Analysis
What prostaglandins and eicosanoids can you quantify?
Our standard panel covers 20+ analytes across three arachidonic acid cascade branches. COX pathway: PGE2, PGD2, PGF2α, 6-keto PGF1α, TXB2, 15-deoxy-PGJ2, 13,14-dihydro-15-keto PGE2, 11-dehydro TXB2. LOX pathway: 5-HETE, 12-HETE, 15-HETE, LTB4, LTC4. CYP450 pathway: 5,6-EET through 14,15-EET, 20-HETE. Custom panels expand to 50+ eicosanoids including resolvins, protectins, maresins, and isoprostanes. See the Detectable PG Species table above for LLOQ and biological context.
Why should I use LC-MS/MS instead of ELISA for prostaglandin measurement?
ELISA kits for PGs have well-documented cross-reactivity — PGE2 antibodies can cross-react with PGD2 and PG metabolites by 10–30%, producing inflated values. When the research question requires distinguishing PGE2 from PGD2 — as in mPGES-1 inhibitor studies where substrate rediversion between these two species is the primary readout — ELISA cannot provide the needed specificity. LC-MS/MS chromatographically separates isobaric PGs before detection, then quantifies each by unique MRM transitions with deuterated internal standard normalization. A single 15-min run quantifies all major PGs and eicosanoids simultaneously, whereas ELISA requires separate kits for each analyte. The ILS community now explicitly recommends LC-MS/MS over immunoassay for oxylipin quantification.
How do you prevent ex vivo prostaglandin synthesis during sample collection?
PGs are produced rapidly ex vivo by activated platelets and leukocytes — blood can generate PGE2 and TXB2 at ng/mL levels within minutes of collection. Our protocol prevents this through: indomethacin (COX inhibitor, 10 μM) and BHT (50 μM) in pre-chilled collection tubes; immediate centrifugation at 4°C; snap-freezing within 15 minutes of collection; and deuterated internal standards spiked at the earliest possible step. We monitor the 11-dehydro TXB2/TXB2 ratio as an ex vivo artifact index — elevated TXB2 relative to its metabolite signals artifactual platelet activation during collection. For tissue samples, flash-freezing in liquid nitrogen and homogenization in ice-cold methanol with indomethacin prevents post-collection PG synthesis.
Can you distinguish COX-1 from COX-2 activity using PG profiling?
Species-level PG profiling provides indirect but informative readouts of COX-1 vs. COX-2 activity. TXB2 (platelet COX-1 product) relative to 6-keto PGF1α (endothelial COX-2 product) reflects the COX-1/COX-2 activity balance — the key selectivity parameter for NSAID and coxib development. PGE2 elevation relative to other PGs suggests COX-2/mPGES-1 pathway activation characteristic of inflammatory states. When combined with selective inhibitors, the pattern of individual PG suppression confirms which COX isoform is driving production. For definitive isoform discrimination, we offer paired analysis of samples ± COX-2-selective inhibitor treatment.
What is substrate rediversion and why does the PGE2/PGD2 ratio matter?
When the COX pathway intermediate PGH2 cannot be converted to one PG due to enzyme inhibition, the substrate is diverted — or "shunted" — to alternative PG synthase pathways. mPGES-1 inhibition blocks PGE2 synthesis, causing PGH2 to accumulate and be shunted toward PGD2 production via H-PGDS and L-PGDS. This has two consequences: the therapeutic effect (reduced PGE2-mediated inflammation) and a potential compensatory mechanism (increased PGD2 and its anti-inflammatory metabolite 15-deoxy-PGJ2). The PGE2/PGD2 ratio is the primary readout for detecting and quantifying this shunt. Tracking substrate rediversion is essential for mPGES-1 inhibitor development because the extent of shunting determines both efficacy and safety — and cannot be measured by ELISA due to PGE2/PGD2 cross-reactivity.
What do I receive in the final data package?
- Excel workbook — PG species data with mean, SD, CV, fold change, and adjusted p-values
- PDF report — publication-ready figures with statistical summary
- Raw data package — MRM chromatograms (.wiff or .mzML), MS/MS spectra, integration boundaries
- Methodology document — complete extraction and LC-MS protocol for manuscript methods section
- QC report card — internal standard recoveries, pooled QC CV distribution, ex vivo artifact index
All data for independent verification and publication.